
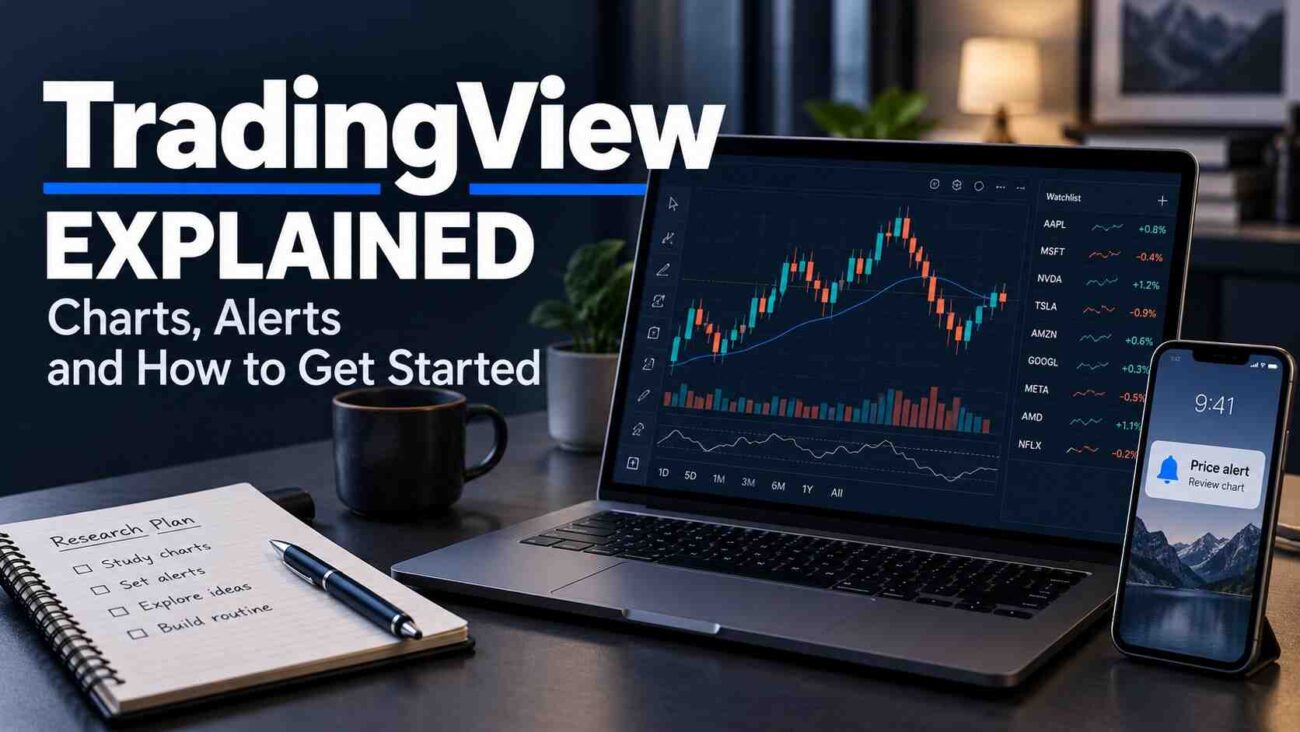
Opening a chart is easy. Knowing whether you selected the right instrument, reliable data and a useful timeframe takes more care. TradingView puts these choices in one workspace, alongside alerts, research tools and simulated trading.
This guide explains how to make TradingView practical from your first session. You will learn to build a readable chart, create meaningful notifications, understand account costs and practice without depositing money. The aim is a process you can explain and repeat, with clear limits around what software can tell you.
What Is TradingView, and Who Is It For?
TradingView is a charting and market-analysis platform covering instruments such as stocks, currencies, cryptocurrencies and futures. Its Supercharts workspace supports technical analysis, comparisons and research.
The official name is TradingView, written as one word even if you searched for trading view. Beginners can learn chart navigation, while experienced users can customize indicators and test rules.
Different TradingView tools answer different questions:
| Tool | Practical purpose | Check first |
|---|---|---|
| Supercharts | Examine price history | Instrument, venue and interval |
| Watchlists | Organize instruments | Exact symbol and provider |
| Stock screener | Filter companies by selected criteria | Market, filters and reporting period |
| Alerts | Monitor defined conditions | Trigger, expiry and notifications |
| Simulation | Practice order handling | Virtual balance and costs |
A screener shortlist is a starting point for investigation, not an endorsement of the companies it finds.
Set Up Your First Chart in TradingView
Choose the exact instrument
Open TradingView Supercharts and use Symbol Search. Type a company name or ticker, then check the exchange and instrument type before selecting a result.
For forex charts, inspect the quote provider. For crypto charts, match the exchange and quote currency. Two listings with similar names can describe different markets.
This is a valuable TradingView habit: write down what you selected. A spot asset, futures contract and derivative are not interchangeable simply because their prices look related.
Pick an interval and simplify the display
Start your TradingView workspace with a daily or hourly interval appropriate to the question you are studying. Each candle summarizes that selected period, rather than representing one transaction.
Use standard candlestick charts while learning. A candle’s body shows opening and closing prices; its wicks show the period’s extremes. The current candle can change until that period ends.
For a first exercise, compare the same instrument on daily and hourly intervals. A decline lasting several hours may sit inside a longer rise. Write the interval beside any conclusion so a later screenshot retains its meaning.
Add one TradingView indicator you understand, such as a moving average. Mark a few relevant support and resistance areas, and record why they matter.
Build a useful trading view by giving every drawing a purpose. If you cannot explain a line, remove it.
Save the workspace and add context
Save your TradingView layout after setting its symbol, interval and indicators. A saved workspace helps you return to the same assumptions instead of rebuilding them from memory.
Your TradingView chart also needs context. Check economic announcements or company disclosures before assuming an indicator explains a sudden move.
For a practical example of how company news helps explain a price move, read our AMZN stock analysis. It examines earnings expectations, AWS growth and investment spending behind Amazon’s share-price reaction.
Create TradingView Alerts That Have a Clear Purpose
TradingView supports price alerts and more complex conditions involving indicators, drawings and strategies. Alerts run on its servers, so the chart does not need to remain open.
To create a basic TradingView notification:
- Select the correct instrument and open Create Alert.
- Define the condition, such as crossing a chosen price.
- Check the available trigger frequency and expiration.
- Choose delivery through the app, email or another supported method.
- Give the alert a name explaining what deserves review.
Suppose a hypothetical share is trading at $48 and you want to review it around $50. Configure TradingView to notify you at that level. The notification prompts investigation; it does not establish a buying opportunity.
With TradingView indicator alerts, one detail is easy to miss: changing the chart indicator’s parameters afterward does not update an existing alert’s saved settings. Recreate it with the revised parameters.
Keep your TradingView alert list short enough to maintain. If notifications disappear into background noise, tighten their conditions and remove obsolete ones.
Check delivery separately: confirm the receiving email address, enable the chosen app or browser notifications, and review expired alerts. A correct condition is ineffective if its message reaches a muted device or an inbox you never open.
Practice in TradingView Before Connecting a Broker
The TradingView paper trading simulator lets you place practice orders using virtual funds. No brokerage deposit is required for that simulation.
From TradingView Supercharts, click Trade and select Paper Trading, then connect. Depending on the interface, this is also accessible through the Trading Panel.
Make the exercise realistic. For example, buying ten simulated shares at $50 and selling at $51 produces $10 before costs. With hypothetical $1 fees on both entry and exit, that falls to $8 before other execution costs. Record commissions, the reason for entry and what would have invalidated it.
A profitable TradingView practice session cannot establish how you will handle live execution or financial pressure. Review losing trades and rule-breaking alongside gains.
For live orders, TradingView connects to supported brokers and exchanges as an interface; the connected provider handles execution. Availability depends on the broker, instrument and jurisdiction.
A TradingView account does not replace checks on broker authorization, account terms or trading costs. Confirm that you are in the intended practice or live account before submitting an order.
TradingView Plans, Data Fees and Common Mistakes
Start with the feature you actually need
TradingView offers a free Basic account and paid Essential, Plus, Premium and Ultimate plans. The comparison below illustrates current chart limits; check the official page before purchasing.
| Plan | Charts per tab | Indicators per chart |
|---|---|---|
| Basic | 1 | 2 |
| Essential | 2 | 5 |
| Plus | 4 | 10 |
| Premium | 8 | 25 |
| Ultimate | 16 | 50 |
These limits come from the platform’s current plan comparison.
Upgrade TradingView when a repeated limitation interrupts your workflow. More indicators are useful only when they answer additional questions. Compare the renewal total, billing period and cancellation terms, not just an introductory monthly equivalent.
Separate the platform subscription from exchange data
A paid TradingView subscription does not automatically include every exchange’s real-time market data fees. Data entitlements are separate from charting features.
Check the TradingView symbol’s market status and any delay notice. Its default U.S. share feed can differ from the primary exchange feed.
Also compare TradingView chart quotes with your broker’s order panel carefully. The panel uses broker-supplied data, so buying an exchange feed for your chart does not necessarily upgrade the broker’s feed.
Treat scripts and community ideas as material to test
TradingView uses Pine Script for custom indicators and strategies. Historical strategy reports simulate orders under assumptions; costs, slippage and unsuitable chart types can distort results.
Treat a popular TradingView idea as a hypothesis. Check its timestamp, rules and losing examples before relying on it. An attractive historical result is not evidence of dependable future returns.
TradingView FAQs
Is TradingView free?
Yes. Basic provides free access with usage limits. Paid tiers add capacity and features, while some exchange feeds require separate subscriptions.
Is TradingView a broker?
No. It supplies analysis tools and an interface for supported brokerage connections. Your connected provider remains responsible for executing live orders.
Can I use TradingView without coding?
Yes. Standard charts, drawings, built-in indicators, watchlists and basic alerts work through the interface. Coding is optional for more customized tools.
Why does TradingView show a different price from my broker?
You may be comparing different providers, instruments, sessions or timestamps. Also check whether one quote is delayed and whether you are comparing bid, ask or last-traded prices.
Does TradingView guarantee profitable trades?
No. Charts organize information and alerts monitor conditions. Neither removes uncertainty, transaction costs or the possibility of losses.
Conclusion
TradingView becomes useful when you can explain your instrument, data source, chart settings and alert conditions. Begin with a simple layout, practice order handling and upgrade only for a clear need.
Keep your trading view focused on a manageable watchlist and a journal you review. Your next step is practical: save one chart, create one purposeful alert and record what you learn before considering live trading.
