

An independent variable is the factor you adjust or compare to examine its relationship with a particular outcome. In a controlled experiment, the researcher sets its values or assigns its categories. The dependent variable is the outcome that the researcher observes and measures during a study.
Consider an experiment that examines whether attaching paper clips to a paper helicopter affects how long it remains airborne. The clip count is the independent variable (IV), and flight time is the dependent variable (DV).
- What Is an Independent Variable?
- Independent Variable vs. Dependent Variable
- How to Find the Independent Variable in 3 Steps
- Independent Variable Examples
- Where to Put the Independent Variable on a Graph
- What Is the Independent Variable in Math?
- Practice Identifying the Variables
- Conclusion
- Frequently Asked Questions
What Is an Independent Variable?
The independent variable in an experiment is often called the manipulated variable because the researcher decides which conditions to test. The levels of the independent variable are the specific values or categories used in the study. If you test helicopters with one, two, and three paper clips, you have one independent variable with three levels.
Clip count is numerical. Instruction format is categorical, with levels such as written instructions and video instructions.
Independent Variable vs. Dependent Variable

| Role | Question to ask | Paper helicopter example |
|---|---|---|
| Independent variable | What do I change or assign? | Number of paper clips per helicopter |
| Dependent variable | What outcome do I record? | Time from release to first contact with the floor, in seconds |
| Control variable | What condition do I keep the same? | Drop height, such as 2 meters for every trial |
Use the same helicopter design and release method at each clip count. Repeat the drops to see how much flight time varies under the same conditions. A control group provides a baseline. If you include a set of helicopters with zero paper clips as your baseline, that set is the control group. Zero clips becomes another level of the independent variable.
How to Find the Independent Variable in 3 Steps
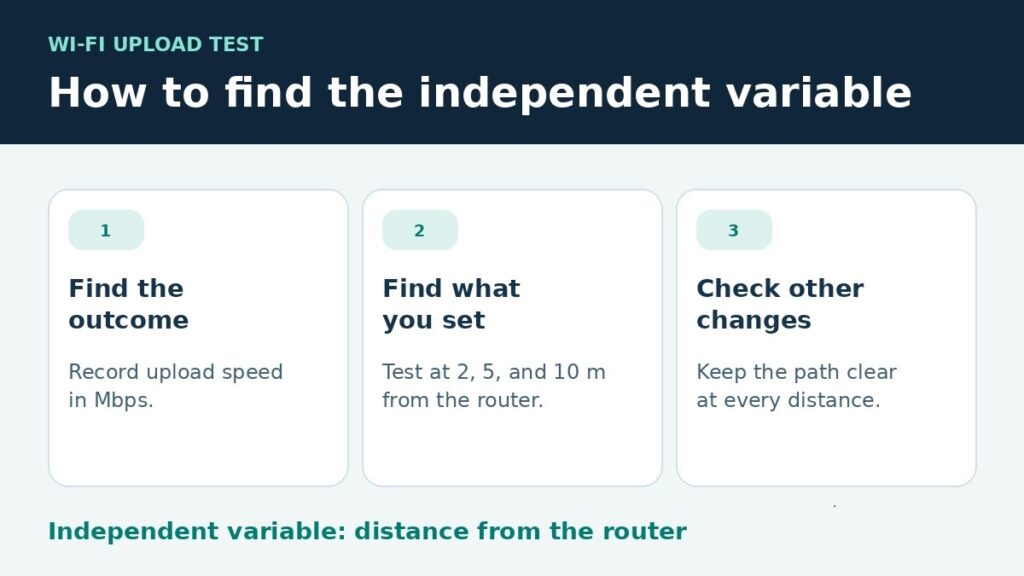
Start with a question you can test. For example, How does distance from a Wi-Fi router affect file upload speed?
1. Identify what the study measures
Ask what you would write down after each trial. In the Wi-Fi test, that’s upload speed in megabits per second. You could use the same laptop, file, and upload destination for every trial.
2. Identify what the researcher sets
Look for the condition the researcher deliberately varies or assigns. Here, you could place the laptop 2, 5, and 10 meters from the router. The independent variable is distance from the router, measured in meters.
3. Check what else changes between trials
If the 2-meter test happens in an open room and the 10-meter test puts a wall between the laptop and router, distance and the wall could both contribute to a change in speed. The wall is a potential confounding variable. Use an unobstructed path at every distance to make the effect of distance easier to assess. To try this at home, follow TechHBX’s guide to testing Wi-Fi speed in different rooms.
Independent Variable Examples
| Research question | Independent variable | Dependent variable |
|---|---|---|
| Does water temperature change how quickly a sugar cube dissolves? | Starting water temperature, such as 10, 25, or 40 °C | Time until the cube dissolves, in seconds |
| Does ramp height affect how far a toy car rolls? | Height of the top of the ramp, in centimeters | Distance the car travels on the floor after leaving the ramp, in centimeters |
| Does video playback speed affect recall? | Assigned playback speed, such as 1×, 1.25×, or 1.5× | Number of correct answers on the same quiz after viewing |
| Does a shorter signup form affect completion? | Form version assigned at random, either short or standard | Percentage of assigned visitors who complete signup within 24 hours |
When researchers observe the variable
In observational research, the independent variable is a factor you record and use to explain or predict an outcome. Suppose a museum tracks rainfall and ticket scans to see whether rain helps predict attendance. Daily rainfall is the explanatory variable, also called a predictor variable. The number of daily ticket scans is the response variable. A pattern could show an association. To claim that rain changed attendance, the museum would need evidence that accounts for other explanations, such as seasonal differences in tourism.
Where to Put the Independent Variable on a Graph
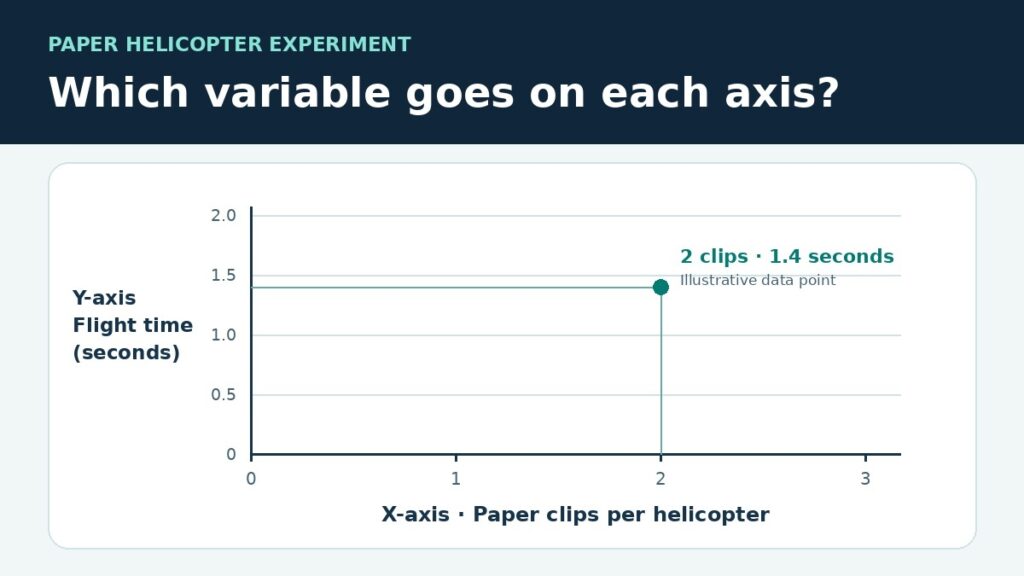
On a typical scatter plot or line graph of an outcome against an input, the x-axis is horizontal and shows the independent variable. The vertical axis, known as the y-axis, represents the dependent variable on a graph. In the helicopter test, the x-axis label would be Paper clips per helicopter, and the y-axis label would be Flight time (seconds). A point at (2, 1.4) would represent a drop in which a helicopter with two clips stayed in the air for 1.4 seconds.
Axis placement is a convention. In a horizontal bar chart, the categories can be displayed along the vertical axis. Use the labels and study question to confirm which variable plays each role.
What Is the Independent Variable in Math?
In a function, the independent variable is the input. The rule uses that input to determine the dependent variable, or output.
Say a bike rental costs five dollars to start and three dollars per hour. Let h be the number of hours rented and C be the total cost in dollars. The rule is C = 5 + 3h. When you choose h = 2, the rule gives C = 11. Rental time is the independent variable, and total cost is the dependent variable.
Practice Identifying the Variables
- A student prints the same 20-page document in draft mode and standard mode. They record the time from clicking Print until the last page leaves the tray. Which two variables are involved, and what different levels of the tested variable are being examined?
- A coach records runners’ weekly training mileage and their 5K finish times to see whether mileage helps predict finish time. The runners choose their own training schedules. Which variable is the predictor?
Answers
- Print mode is the independent variable, with draft and standard as its levels. Total print time is the dependent variable.
- Weekly training mileage is the predictor, and 5K finish time is the outcome. This is an observational study because the coach records the runners’ mileage as it occurs.
Conclusion
Before you run a test, write down the factor you’ll vary and the result you’ll record. If your research question uses a phrase like works better, decide what would count as better. Finishing a task in fewer seconds and finishing it with fewer errors are two different outcomes. Choose the one that answers your question, or record both if each matters.
Frequently Asked Questions
Can you have more than one independent variable?
Yes. You could test two oven temperatures and two baking times to see how they affect cookie moisture. Testing all four combinations is a factorial design. It lets you examine whether the effect of baking time differs between the two temperatures.
Can time be an independent variable?
Yes. If you record coffee temperature at 0, 5, and 10 minutes after pouring, elapsed time is the input for the cooling curve. Temperature is the outcome measured at each time.
Can the same variable play different roles in different studies?
Yes. Distance from a router is the independent variable when you set the distance and measure upload speed. If you compare router models and measure the farthest distance at which each sustains 10 Mbps, router model is the independent variable and maximum distance is the outcome.
Can you measure more than one dependent variable?
Yes. If you compare two study guides, you could measure both quiz score and time to finish the quiz. The assigned guide is the independent variable, and each measurement is a separate dependent variable.
What if changing the independent variable makes little difference?
It keeps its role because that role comes from the study design. If flight times are similar across clip counts, report the number of trials and how much the times varied. A small or noisy experiment can make a real difference hard to detect.
