

Imagine watching a token jump 30% while your portfolio barely moves. The headline says cryptocurrency is booming; your experience says otherwise. The missing context is often market capitalization, supply, and the difference between a quoted price and an achievable sale.
For anyone researching fintechzoom.com crypto, the useful question is not simply, “Which coin ranks highest?” It is, “What explains the number, and what could make it misleading?” This guide grounds its analysis in primary sources and public records, utilizing illustrative scenarios rather than live quotes or personal interviews.
- Verify the Platform Before Trusting the Dashboard
- Crypto Market Cap Measures Size, Not Money Invested
- Circulating Supply, Total Supply, and FDV: Read the Fine Print
- ABC Coin: A Practical Valuation Table
- Read Bitcoin Dominance Alongside Market Breadth
- Trading Volume Is Activity; Liquidity Is Your Exit
- Behind the Numbers: An Investor’s Documented Loss
- Your Repeatable Analyst Checklist
- Frequently Asked Questions
- Conclusion: Replace Conviction With Verification
Verify the Platform Before Trusting the Dashboard
FintechZoom describes its information as educational rather than investment advice. During research, its accessible Crypto Market Cap category returned “No Content Available.” That finding does not establish whether other pages contain working widgets, but it prevents confidently describing this category as a verified live dashboard.
Approach fintechzoom.com crypto coverage as a starting point for questions, not automatic confirmation of current crypto prices. Check the original data provider, timestamp, exchange coverage, and supply methodology.
Compare crypto prices in the same currency and time window. Dollar gains can coexist with losses against Bitcoin, while a revised supply estimate can alter crypto rankings without new trading.
A useful fintechzoom.com crypto habit is recording the exact page address. Similarly named websites are not evidence about FintechZoom itself.
Crypto Market Cap Measures Size, Not Money Invested
Market capitalization equals price multiplied by circulating supply. CoinMarketCap’s methodology, updated in January 2026, ranks assets using circulating market capitalization and describes aggregate market cap as the sum of qualifying assets’ individual valuations.
Your fintechzoom.com crypto analysis should separate that implied market valuation from cash invested. Suppose ABC Coin has ten million circulating tokens. A price increase from $2 to $3 raises its crypto market cap from $20 million to $30 million. It does not demonstrate that buyers deposited $10 million.
Prices emerge from transactions at the margin; applying a new reference price to every circulating token creates the larger valuation change. Selling everything at that price would require buyers who may not exist.
Consequently, fintechzoom.com crypto headlines about billions “entering” or “leaving” a market deserve scrutiny unless they measure actual flows separately.
Circulating Supply, Total Supply, and FDV: Read the Fine Print
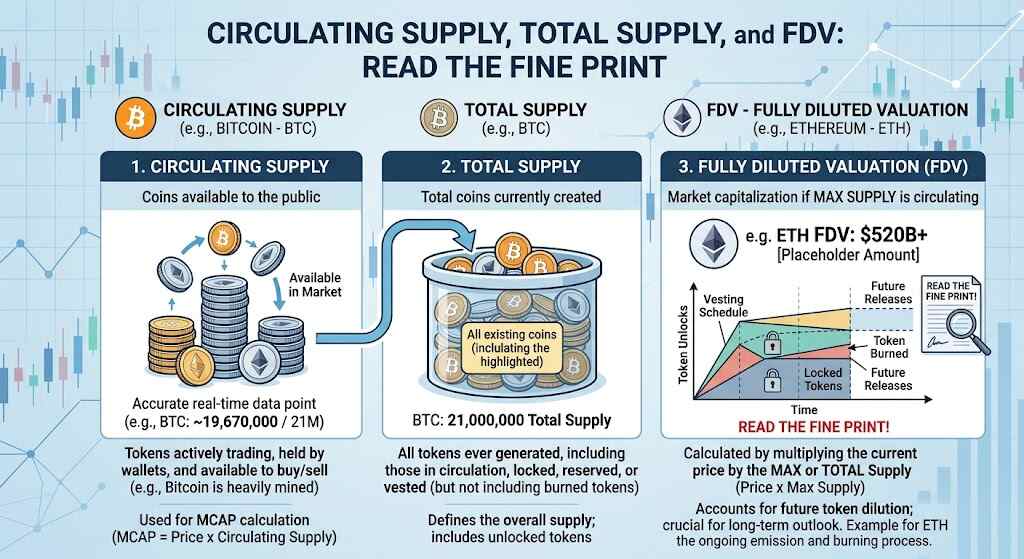
Circulating supply estimates tokens in public hands. Total supply counts existing tokens after verified burns. Maximum supply describes the defined issuance ceiling. Fully diluted valuation (FDV) multiplies price by maximum supply under CoinMarketCap’s convention.
For fintechzoom.com crypto comparisons, the crucial distinction is that unlocked tokens are not necessarily circulating tokens. CoinMarketCap generally excludes insider allocations even when unlocked. Two providers can therefore report different crypto rankings without observing different transactions.
Check vesting schedules against wallet disclosures. An unlock creates potential selling capacity, not proof of immediate sales. Token burns likewise do not guarantee appreciation: demand and the location of burned tokens matter.
Fully diluted valuation also ignores issuance timing. Study vesting schedules over your intended holding period, rather than treating eventual dilution as tomorrow’s supply shock.
Add a supply check to every fintechzoom.com crypto watchlist. Where no finite maximum exists, inspect the provider’s FDV convention rather than assuming a dependable ceiling.
ABC Coin: A Practical Valuation Table
Use this hypothetical fintechzoom.com crypto worksheet before comparing cheap-looking tokens with Bitcoin or Ethereum.
| Metric | Hypothetical value | Interpretation |
|---|---|---|
| Token price | $2 | Quoted unit price |
| Circulating supply | 10 million | Tokens in public hands |
| Total supply | 60 million | Existing tokens after burns |
| Maximum supply | 100 million | Defined issuance ceiling |
| Crypto market cap | $20 million | Price multiplied by circulating supply |
| Fully diluted valuation | $200 million | Price multiplied by maximum supply |
Only 10% of maximum supply circulates here. The gap flags dilution exposure, not an automatic overvaluation verdict.
If circulating supply becomes twelve million while market cap remains $20 million, price becomes approximately $1.67. That is conditional arithmetic, not a forecast. Before projecting returns, an analytical reader evaluates whether market demand can realistically absorb upcoming token unlocks.
Read Bitcoin Dominance Alongside Market Breadth
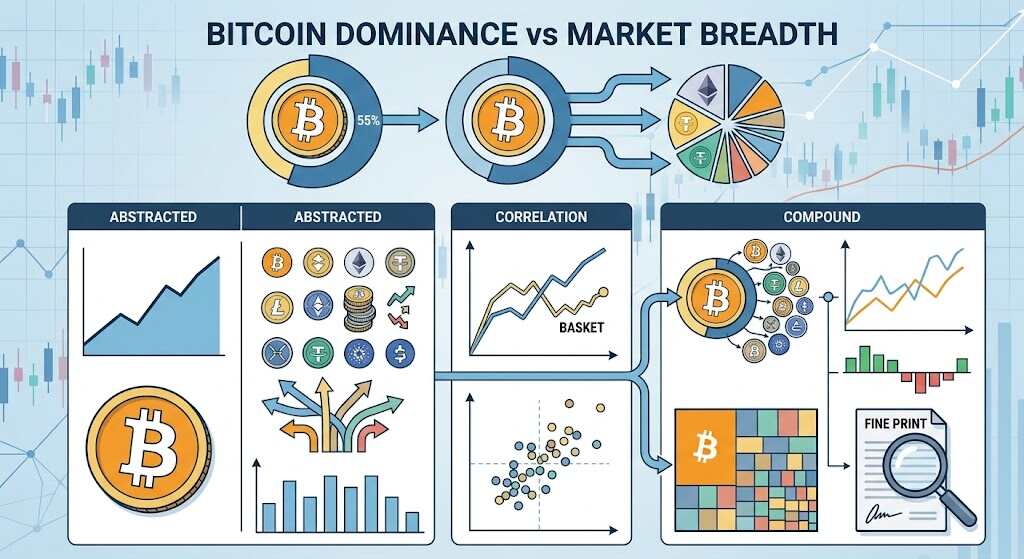
Bitcoin dominance divides Bitcoin’s market cap by aggregate crypto market cap. CoinMarketCap includes tokens and stablecoins in its tracked universe, so the denominator matters.
Use fintechzoom.com crypto commentary to frame competing explanations. A rise in Bitcoin dominance isn’t always driven by a Bitcoin rally—it frequently occurs when altcoins suffer steeper declines during a broader market drawdown. Neither outcome alone proves fresh buying.
Compare consistent daily snapshots, then examine seven-day and thirty-day changes. Check whether Ethereum and a broad selection of altcoins participate. A rally concentrated in one heavyweight is different from widespread strength.
For fintechzoom.com crypto trend notes, separate stablecoin growth from appreciation in volatile assets. Stablecoin issuance can change aggregate capitalization without demonstrating equivalent demand for Bitcoin. Market sentiment should support the evidence, not replace it.
Also Read: Fintechzoom.com: How AI Is Reshaping Fintech in 2026
Trading Volume Is Activity; Liquidity Is Your Exit
Trading volume measures transactions during a period; liquidity concerns executing trades without substantial price impact. CoinMarketCap’s liquidity methodology evaluates simulated slippage and prioritizes orders between $100 and $10,000.
CoinMarketCap’s June 2026 documentation uses a 0–1,200 liquidity scale. Higher scores suggest lower modeled slippage, not guaranteed execution during a sudden market shock or across different trading venues.
A fintechzoom.com crypto assessment should inspect the actual exchange pair you would trade. Wide spreads, shallow bids, and concentrated activity can make impressive trading volume less reassuring.
Imagine a $5,000 sale when only $800 of bids sit near the displayed price. Your order may consume progressively lower bids. A limit order controls the minimum acceptable price but might remain unfilled.
Before acting on fintechzoom.com crypto enthusiasm, test the exit: order-book depth, likely slippage, fees, and withdrawal availability. Market cap cannot answer those questions.
Behind the Numbers: An Investor’s Documented Loss
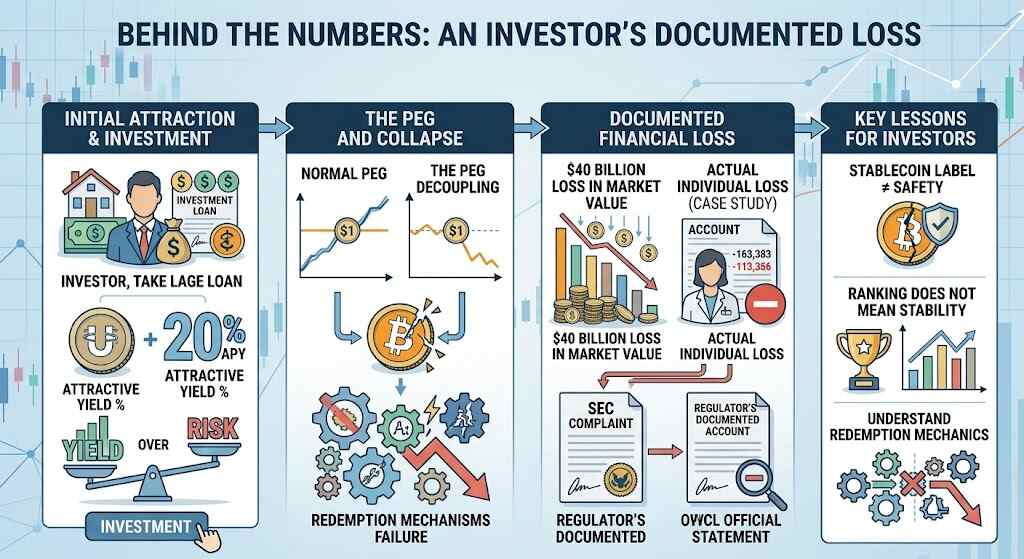
The SEC’s amended Terraform complaint described a California pharmacist who borrowed $400,000 against his home to buy UST and lost his investment. This is a regulator’s documented account, not an interview conducted for this article.
Following a fraud verdict, the SEC reported that UST’s collapse and related token declines erased $40 billion in market value. Those historical figures describe valuation losses, not an independently measured total of cash withdrawals.
For fintechzoom.com crypto readers, the lesson is concrete: a stablecoin label, prominent ranking, or attractive yield cannot substitute for understanding redemption mechanics and failure risks.
Your Repeatable Analyst Checklist
Make each fintechzoom.com crypto review reproducible:
- Save the timestamp, quote currency, source, and measurement period.
- Recalculate market cap using the stated circulating supply.
- Compare FDV, vesting schedules, and insider allocations.
- Check trading volume alongside spreads and executable liquidity.
- Compare Bitcoin dominance with broader participation.
- Write one alternative explanation and one condition that would invalidate your thesis.
Keep screenshots or exported observations. Without consistent inputs, comparing today’s crypto prices with yesterday’s rankings can manufacture a trend that is really a methodology change.
Treat crypto rankings as size comparisons, not quality scores. Ask how a market valuation relates to network usage, token demand, and holders’ rights. Market valuation alone cannot establish sustainable value.
Frequently Asked Questions
Is FintechZoom a replacement for verified market data?
Use fintechzoom.com crypto reporting for context, then verify numerical claims with the named provider and original project disclosures. Unclear sourcing warrants caution.
Does a low token price mean a bargain?
No. Supply determines how unit price translates into crypto market cap. Compare valuation, utility, dilution, and liquidity rather than counting decimal places.
Are large-cap cryptocurrencies automatically safe?
No. Large-cap crypto, mid-cap crypto, and small-cap crypto are descriptive categories with varying thresholds, not guarantees against volatility, fraud, or losses.
Can FDV predict tomorrow’s price?
No. In fintechzoom.com crypto research, FDV is a comparison tool. It holds price constant while changing the supply assumption; future demand remains uncertain.
How often should beginners review these indicators?
A consistent daily or weekly fintechzoom.com crypto routine is usually more informative than reacting to every tick. Review major disclosures when they occur.
Conclusion: Replace Conviction With Verification
The strongest fintechzoom.com crypto analysis starts where the headline ends: identify the source, reconstruct the valuation, inspect supply, and test whether an exit is realistically executable. Combine Bitcoin dominance with breadth and trading volume with liquidity. Most importantly, connect each metric to a decision you can explain without hype. You do not need to predict every rally; you need a process that exposes weak assumptions before real savings depend on them. This guide is educational, not personalized investment advice.
